You don’t need a degree in data science to understand if your website is actually helping your business grow.
Most small business owners get overwhelmed when they open an analytics dashboard. They are immediately hit with complex terms like “bounce rates,” “session durations,” and confusing graphs that look like a stock market ticker. When metrics are too complicated, it is easy to stop looking at them entirely and just guess whether your digital marketing is working.
Simple AI tools remove this confusion. By translating raw data into everyday business insights, AI allows you to read your website’s performance numbers easily, helping you make smart decisions without the headache.
1. Turning Complicated Charts Into Plain Text Summaries
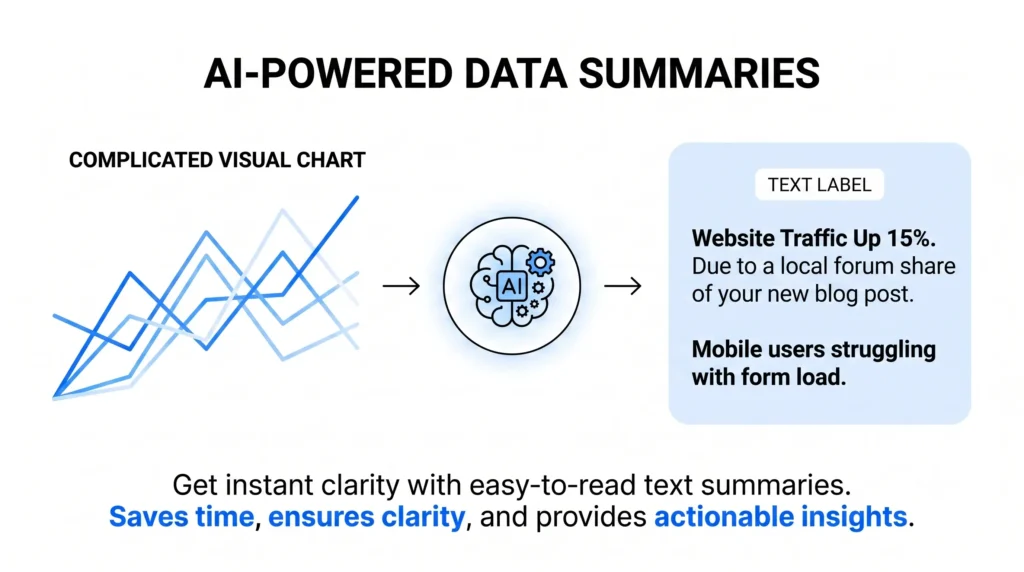
Looking at a graph with five different colored lines can make it incredibly difficult to spot what is actually working and what isn’t.
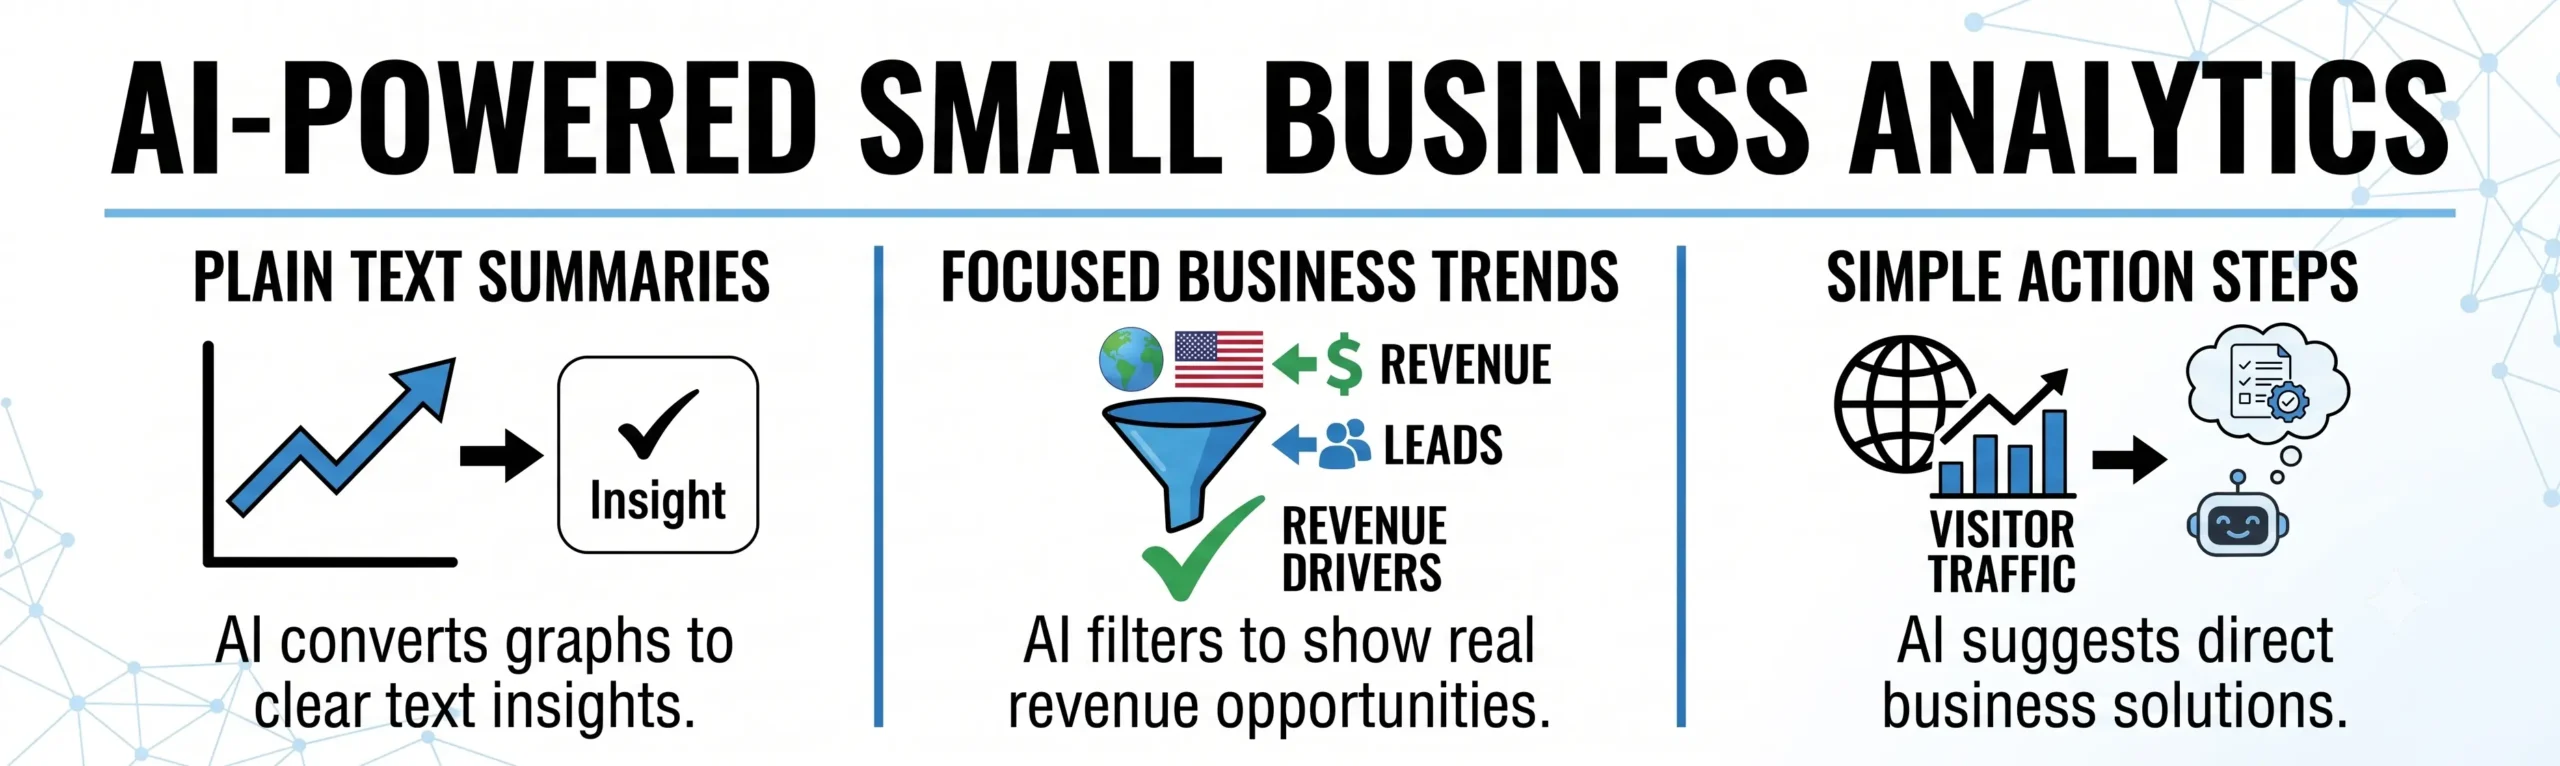
- How AI Helps: Instead of making you decipher a visual chart, built-in AI assistants read the data and write out a simple, 2-sentence summary right at the top of your dashboard.
- The Benefit: Instead of guessing what a sharp line drop means, you read a clear sentence: “Your website traffic went up by 15% this week because your new blog post was shared on a local forum, but mobile users are struggling to load your contact form.” You get instant clarity on exactly what happened.
2. Filtering Out the “Noise” to Focus on What Matters
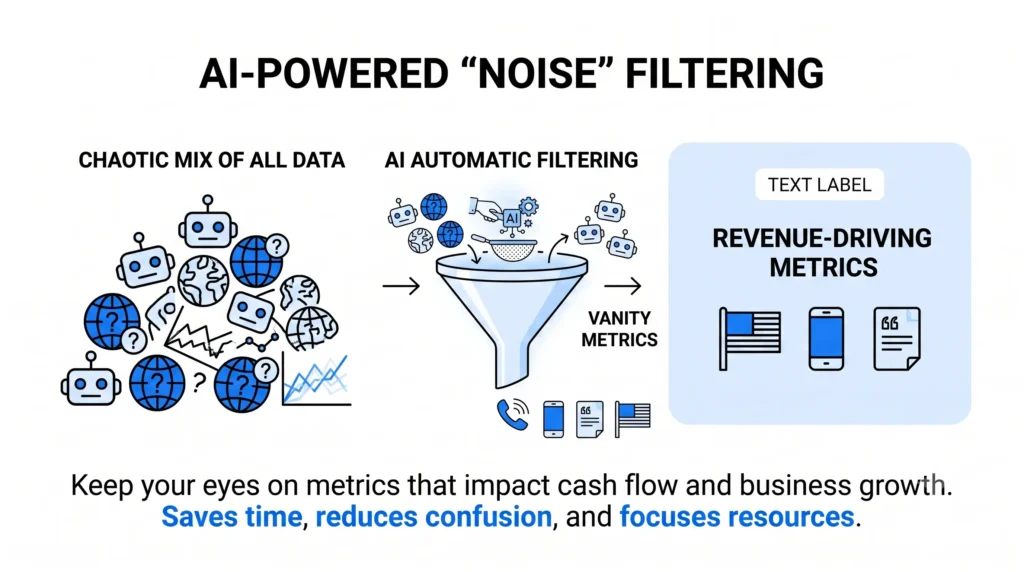
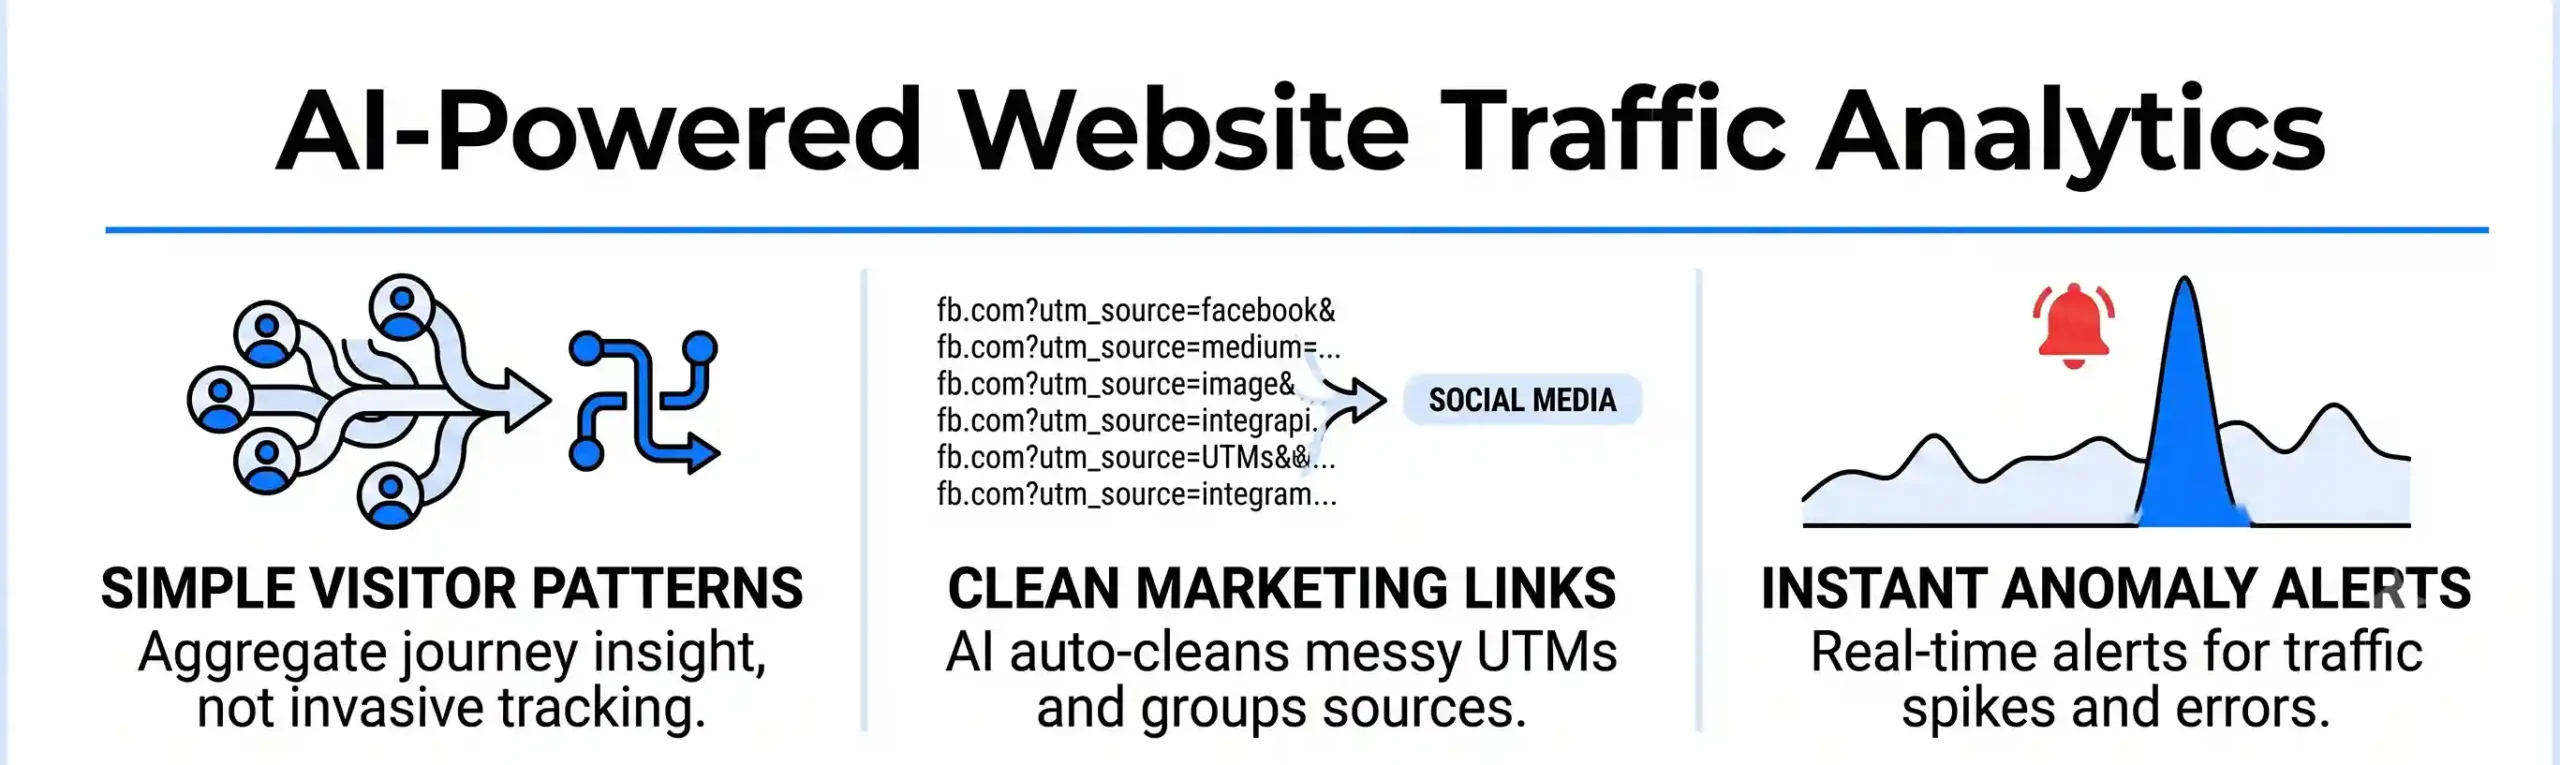
Not all website numbers are important. For example, a sudden spike in page views sounds great, but if those visitors are random bots or people from outside your service area who will never buy from you, that number doesn’t matter.
- How AI Helps: Simple analytics tools use AI to separate “vanity metrics” (numbers that look good on paper but don’t drive revenue) from real business trends. The AI automatically highlights your high-value metrics, such as how many local users clicked your phone number or filled out a quote form.
- The Benefit: You save time by ignoring useless data. You can keep your eyes entirely on the numbers that actually impact your cash flow and business growth.
3. Getting Simple Action Steps, Not Just More Data
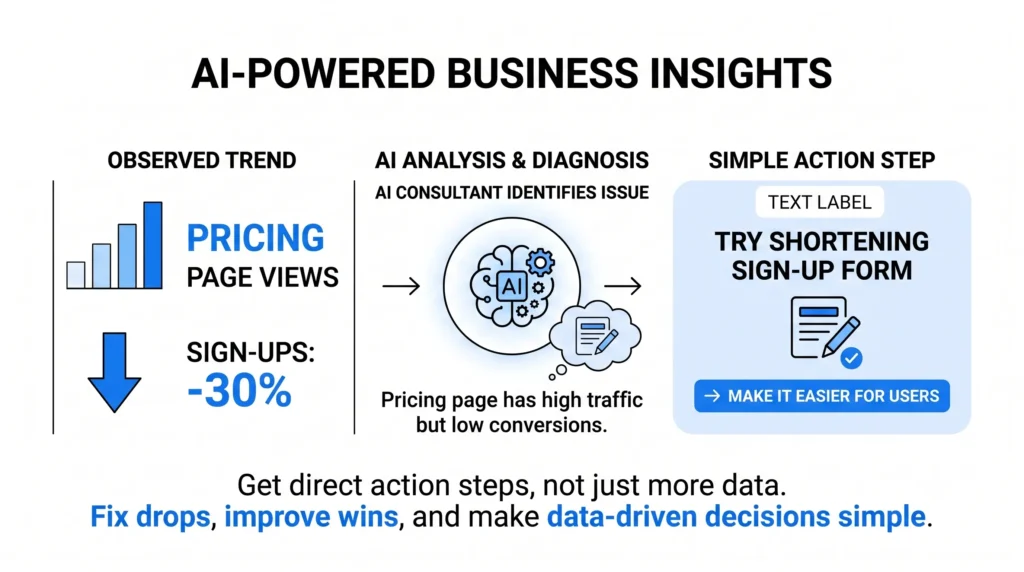
The most frustrating part of standard data dashboards is that they tell you what happened, but they never tell you what to do next to fix a drop or improve a win.
- How AI Helps: AI functions like a helpful digital business consultant. When it notices a change in your numbers, it automatically suggests a clear action step based on that trend.
- The Benefit: If your pricing page views are high but sign-ups drop, the AI doesn’t just show a negative percentage; it suggests a simple solution: “Your pricing page has high traffic but low conversions. Try shortening the sign-up form to make it easier for users.”
The Outcome: Running Your Business on Facts, Not Guesses
Data shouldn’t be a puzzle you have to solve every week. By letting simple AI tools summarize your traffic charts, filter out the noise, and provide clear action steps, you turn your website metrics into an easy-to-use guide for your business. You get all the benefits of data-driven decisions without any of the confusion.
At Nuclay Solutions, we build clean, simple dashboards directly into our clients’ websites. We help you cut through the technical clutter so you can clearly see what drives your growth and where to focus your energy next.
Stop Guessing Your Website Performance
Get a clear direction for growth. Connect with Nuclay to turn confusing traffic numbers into simple, revenue-driven insights.
Simplify Your Analytics